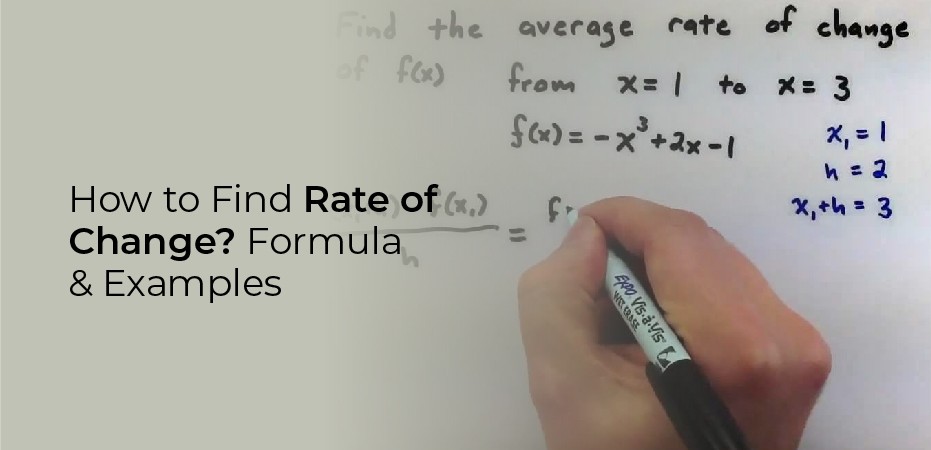
How to find the rate of change? An average rate of change provides insight into a variety of applications. The average rate of change can be calculated using the simple algebraic formula: (y1 – y2) / (x1 – x2).
In addition, knowing how to apply the average rate of change can be beneficial for a variety of uses. In this article, we will explain what the average rate of change is, how it is calculated, and how it is used. We’ll also provide examples to help you better understand why this measurement is important.
What is the average rate of change?
The average rate of change measures how much a function changes per unit interval, in other words, the movement between two points on a coordinate plane. The average rate of change is also known as “slope,” and it can be calculated using the following algebraic formula:
y = (mx + b)
To find the average rate of change between two sets of coordinates, you can use this formula:
(y1-y2) / (x1-x2)
In a graph, the average rate of change represents the rise or fall in elevation, such as with land features. However, this measurement is useful and important for a wide range of applications.
How is the average rate of change used?
The average rate of change, or slope, is a very useful tool for assessing the rate at which something changes over time. In the following cases, the average rate of change can be useful as a measure of change over time:
Construction, engineering, and architecture
In the construction industry, slope is a mathematical concept of great importance. New building plans, for instance, need accurate measurements and calculations about the topography of a location and how changes in elevation impact the construction of structures.
Using this information, engineers and architects can develop structural plans for construction projects. To ensure the viability of structures such as buildings, roadways, bridges, and other infrastructure, engineers and architects create plans based on land slope.
Finance and accounting
The average rate of change can provide valuable and crucial insight into things like investment expectations, projected outcomes in stocks, and other applications where it’s necessary to understand how various changes over time can affect investment returns.
Investors in the stock market can use the rate of change to identify trends like security momentum and price points over time. It is extremely important to consider this when investing in financial channels like mutual funds.
Sales
In sales applications, the average rate of change can be useful for gauging the effect that different product costs, prices, and margins have on a business’s profit growth. Let’s assume that a business sells a variety of products with varying production costs, price points, and profit margins.
The business would use the average rate of change for costs, prices, and margins to measure the effect these changing values have on its overall profit generation. When done correctly, it can be extremely useful for identifying which products fail to generate expected revenue and which products exceed expectations.
How to calculate the average rate of change
In its simplest sense, the average rate of change uses the following formula when applied to coordinates on a graph:
(y1 – y2) / (x1 – x2)
Identify your first set of coordinates
Decide which coordinate pair to designate as “set 1.” For example, assume you have a coordinate pair of (3, 4) and another coordinate pair of (1, 2). You can designate the following coordinates (3, 4) as “set 1.” This results in x1 and y1 for the formula.
Identify your second set of coordinates
By using the previous coordinates (3, 4) and (1, 2), the coordinate pair (1, 2) becomes “set 2” and will be your x2 and y2 values in the formula. Thus, x1 is 3, y1 is 4, x2 is 1, and y2 is 2. Now that you know the values, you can plug them into the formula.
Subtract your y values
Put your “y” values into the corresponding places in the formula. As an example, consider the coordinate pairs (3, 4) and (1, 2):
(y1 – y2) / (x1 – x2) = [(4) – (2)] / (x1 – x2) = 2 / (x1 – x2)
Subtract your x values
Subtract the “x” values from their appropriate places in the formula. Here’s what it looks like with (3, 2) and (1, 4):
(y1 – y2) / [(3) – (1)] = (2) / (2)
Divide the differences
You can divide the difference between your “x” and “y” values once you have subtracted both:
Since (2) / (2) = 1, the average rate of change is 1.
You can convert the average rate of change to a percent by multiplying your final result by 100, which gives you the average percent of change. The rate of change can also be positive or negative, where a positive slope indicates an increasing pattern and a negative slope indicates a decreasing pattern.